New Fed Chair Challenges

RECAPPING LAST WEEK


Major US equity indices pushed to fresh highs early in the week, as AI and semiconductor strength helped
support the S&P500 and Nasdaq, before rising yields and renewed inflation concerns pressured growth stocks
into the close. Market leadership remained narrow and tech–driven, with investors continuing to reward AI–
related earnings momentum, though high–multiple equities remain sensitive to any backup to rates. Treasuries
weakened across all maturities flirting with some cases crossing psychologically important yield levels that
also represent 1–year highs with 2 years at 4%, 10 at years 4.5% and 30 years poking through 5% for the first
time since last summer. The catalyst was the hotter than expected CPI and PPI reports, showing year over
year inflation running at 3.8% and 6% respectively which not only killed market expectations of any chance of
a near term cut but meaningfully priced in chances for hikes by year end. Fed Funds Futures began the week
at a 95% likelihood that the FOMC would hold rates steady at its June 17th meeting, with a 5% chance of a 25
basis point cut. Those figures ended the week at 99.2% and 0.8% respectively. Perhaps more importantly
looking further out towards the last meeting of the year, the market now sets a 50% chance of no rate
change, a 40% chance of a 25 bps hike and a 10% chance of a 50 bps hike. The dollar, while largely a non–
event for over a year, firmed a touch against all the major currencies through Thursday and moved sharply
higher on Friday as part of the market’s realignment to pricing in a meaningful potential for rate hikes. Crude
oil remained firm with the now active July contract hovering around $100 per barrel while the strong
backwardation remains as the soon to expire June contract is trading north of $105. The cease–fire with Iran
remained in place even as the U.S. dismissed that country’s conditions for reopening the Strait of Hormuz.
This appeared to be driven more by the need to avoid distractions during the U.S./Chinese summit, rather than
hopes for an imminent diplomatic solution. Precious metals were part of Friday’s overall “risk–off” trade
despite holding firm earlier in the week, with silver down over 10% on the day. The U.S. delegation to the
Beijing Summit included CEOs representing more than 20% of the market cap of the S&P 500, so the event
had the potential to generate market moving news, though in reality few deals were announced. After the first
day Reuters reported that Nvidia was granted approval to sell their 2nd tier H200 chips to 10 Chinese firms, but
follow–up reporting implied that the Chinese were at best indifferent to this offer. The administration’s
announcement that China had committed to purchasing 200 Boeing jets was the only other notable deal with
numbers attached, and the President later commented to reporters that the final number could be as high as
750 if delivery of the first 200 goes well. Treasury’s Bessent also mentioned in an interview on Thursday that
the US would be dropping tariffs against “cheap consumer goods” that the U.S. has no interest in
manufacturing domestically but there wasn’t much in the way of follow up coverage. For the Chinese,
attempting to alter the U.S’s “strategic ambiguity” policy concerning Taiwan was the main opportunity.


THE WEEK AHEAD


It’s said that the market likes to throw a challenge at new Fed chairs, and Mr. Warsh may certainly have one
on his hands, given the political pressure to cut rates even as the markets have transitioned to pricing in hikes.
Will skeptical FOMC members buy into his argument that large scale AI adoption will lead to a productivity
boom that would offset any energy related inflation? Alternatively, he could argue simply that hiking rates isn’t
appropriate to counteract a perceived short term supply shock in a key commodity that is already adversely
impacting lower and middle income consumers. Global PMIs will be a key cross–market catalyst, with
preliminary reading from the U.S., Germany, the Eurozone, and the U.K. helping investors assess whether
global manufacturing and services momentum is improving or being pressured by higher input costs.
Domestically, the U.S. economic calendar doesn’t offer much else in the way of impactful data this week. On
the international front, Tuesday and Wednesday will offer a look at how the energy price spike is affecting
Canadian and UK consumers with the release of their CPI reports and Australian unemployment figures are
released on Thursday. With the Beijing summit in the rearview mirror, the focus will likely turn back to Iran. As
of the time of this writing, diplomatic efforts seem stalled and the administration appears to be growing
increasingly frustrated that efforts to get the Strait of Hormuz opened have yet to yield meaningful results.
Speaking of yields, with rates across the curve sitting at, near, or just through one–year highs, some will
wonder if Mr. Warsh will be dealing with “Bond Vigilantes” right out of the gate. The prospectus for the
SpaceX IPO could be filed as early as this week, which would start the 20 day “quiet period” window before
the IPO could occur. Some reporting has indicated that the roadshow will commence June 8th with a valuation
of $1.25 Trillion, though the public offering will “only” be in the $70–$75 billion range. It’s yet to be determined
whether SpaceX will be added to indices like the Nasdaq 100 imminently, a carrot that the exchange had been
rumored to be offering as an incentive to secure the listing. At the $1.25T valuation, it would be the 10th largest
component of the index, behind Meta (META) and ahead of Walmart (WMT), representing about a 3.5%
weighting in the index. The QQQ ETF alone, with assets of $464B, would have to acquire about $16B worth of
shares, over 20% of the public float. While we just addressed the largest anticipated IPO ever, it’s only fitting
that we finish addressing the longest continuously listed security. On Thursday, the Bank of New York,
founded in 1784 and first publicly traded in 1792 from the “Buttonwood Agreement” that laid the foundation for
the NYSE, will change its ticker symbol from BK to BNY. Quite the legacy there, Mr. Hamilton

(Schwab)

Annualized Return: The rate at which an investment grows each year over the period to arrive at the final valuation.

Bear Market: A decline of at least 20% from the market’s high point to its low.

Beta: A measure of how an individual asset moves when the overall stock market increases or decreases.

Correlation: A measure of the extent to which two variables are related.

Dividend Yield: The dividend yield or dividend-price ratio of a share is the dividend per share, divided by the price per share. It is also a company’s total annual dividend payments divided by its market capitalization, assuming the number of shares is constant.

Developed Markets: A country that is most developed in terms of its economy and capital markets. The country must be high income, but this also includes openness to foreign ownership, ease of capital movement, and efficiency of market institutions.

Emerging Markets: A country that has some characteristics of a developed market but does not fully meet its standards. This includes markets that may become developed markets in the future or were in the past.

Growth Factor Stocks: Growth stocks are companies expected to grow sales and earnings at a faster rate than the market average.

Large Cap Stocks: Shares of publicly traded corporations with a market capitalization of $10 billion or more.

LTM: An acronym for “Last Twelve Months” or the past one year.

NTM: An acronym for “Next Twelve Months” or the next one year.

Price Return: The rate of return on an investment portfolio, where the return measure takes into account only the capital appreciation of the portfolio, not including income generated in the form of interest or dividends.

Total Return: Return on a portfolio of investments including capital appreciation and income received on the portfolio.

Small Cap Stocks: Small-cap stocks are shares of companies with a market capitalization of less than $2 billion.

Standard Deviation: In statistics, the standard deviation is a measure of the amount of variation or dispersion of a set of values. A low standard deviation indicates the values tend to be close to the historical average of the data set, while a high standard deviation indicates the current value is outside of the historical average range.

Value Factor Stocks: Stocks that are inexpensive relative to the broad market based on measures of fundamental value (e.g., price to earnings or price to book).

Disclosures and legal notice

DISCLAIMER: Futures, stocks and options trading involves substantial risk of loss and is not suitable for every investor. The valuation of futures, stocks and options may fluctuate, and, as a result, clients may lose more than their original investment. The impact of seasonal and geopolitical events is already factored into market prices. The highly leveraged nature of futures trading means that small market movements will have a great impact on your trading account and this can work against you, leading to large losses or can work for you, leading to large gains.

  • If the market moves against you, you may sustain a total loss greater than the amount you deposited into your account. You are responsible for all the risks and financial resources you use and for the chosen trading system. You should not engage in trading unless you fully understand the nature of the transactions you are entering into and the extent of your exposure to loss. If you do not fully understand these risks you must seek independent advice from your financial advisor. All trading strategies are used at your own risk.
  • Any content on T2 Markets Research should not be relied upon as advice or construed as providing recommendations of any kind. It is your responsibility to confirm and decide which trades to make. Trade only with risk capital; that is, trade with money that, if lost, will not adversely impact your lifestyle and your ability to meet your financial obligations. Past results are no indication of future performance. In no event should the content of this correspondence be construed as an express or implied promise or guarantee.
  • T2 Markets Research is not responsible for any losses incurred as a result of using any of our trading strategies. Loss-limiting strategies such as stop loss orders may not be effective because market conditions or technological issues may make it impossible to execute such orders. Likewise, strategies using combinations of options and/or futures positions such as “spread” or “straddle” trades may be just as risky as simple long and short positions. Information provided in this correspondence is intended solely for informational purposes and is obtained from sources believed to be reliable. Information is in no way guaranteed. No guarantee of any kind is implied or possible where projections of future conditions are attempted.

Disclaimer: None of the content published on T2 Markets Research constitutes a recommendation that any particular security, portfolio of securities, transaction or investment strategy is suitable for any specific person. None of the information providers or their affiliates will advise you personally concerning the nature, potential, value or suitability of any particular security, portfolio of securities, transaction, investment strategy or other matter.

Free newsletter

Market Research & Analysis

Get our latest reports and commentary delivered to your inbox.

Keep reading

More from the research library

Short-term yields rising

Global equity markets remained remarkably resilient last week despite another sharp rise in interest rates, elevated energy prices, and the first rate hike from the Federal Reserve in more than three years. U.S. equities initially came under pressure following Wednesdays widely anticipated 25 basis point increase in the Fed Funds target rate to 3.75%-4%, but the selloff was relatively short-lived, with most major indices recovering from their knee-jerk response to the rate announcement.

Read more →

Investors focused on the FOMC’s 2-day meeting

Global equity markets were under pressure last week with rising energy prices, escalating U.S.-Iran hostilities, and another leg higher in Treasury yields. U.S. equities gave back much of the gains from the prior week, with the S&P 500, Nasdaq 100, and Russell 2000 all slipping a little Tuesday through Thursday before regaining some ground on Friday. The selloff was relatively orderly, with the market continuing to focus on whether the increase in energy prices represents a temporary
geopolitical shock or the beginning of a more persistent inflation problem.

Read more →

Final look at inflation data

Global equity markets were quietly choppy this week as investors grappled with a rise in global bond yields, a renewed escalation in U.S.-Iranian hostilities and a shifting outlook for Fed policy.U.S. equities came under pressure early in the week as the global bond selloff and higher energy prices challenged elevated valuations, although stocks recovered as the week progressed, with theS&P 500, Nasdaq 100, and Russell 2000 posting modest gains of under a half a percent.

Read more →

Free newsletter

Market Research & Analysis

Get our latest reports and commentary delivered to your inbox.

Inside a recent report

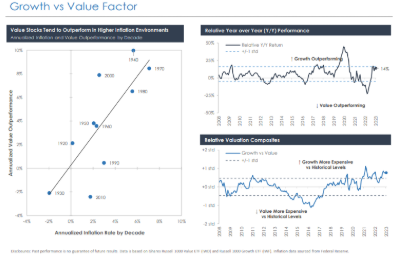
Growth vs Value Factor chart

Growth vs Value Factor — one of the charts from our research.