Focus on Labor Market

RECAPPING LAST WEEK

All U.S. equity indices hit record highs last Monday, with momentum fueled by NVDA’s
$100B data center investment with OpenAI. Gains faded after Fed Chair Powell flagged
stock valuations and second quarter GDP was revised up to 3.8%, tempering
expectations for two more rate cuts this year.

Major indices ended the week modestly lower, falling less than 1% each. Metals advanced further, with gold rising 2% and silver rocketing higher by more than 7%. Only the energy and utilities sectors managed to stay positive, rising 4% and 2% respectively. The energy rally was supported by surging oil prices amid reduced Russian exports and multiple Ukrainian drone attacks on Russia’s energy infrastructure. U.S. economic data was mixed. Business activity slowed for a second straight month, with S&P Global’s flash composite PMI easing to 53.6 in September, dragged by weaker manufacturing and services. Firms flagged tariffs as the main driver of higher input prices, but weak demand limited their ability to pass through costs. New home sales surged 20.5% in August, the best result in 3 years, but existing home sales were flat. Median home prices increase 2% YoY which appears to be largely a result of investors’ influence–28% of sales were all-cash. Durable goods orders rose 2.9% in August and the goods trade deficit narrowed sharply to $85.5B.

Jobless claims came in below expectations at 218k, but continuing claims remained elevated, signaling longer unemployment spells. Inflation held steady with Fridays Core PCE at 2.9%, but expectations are for that to turn higher, with 1-year expectations up to 4.7% helping pull consumer sentiment down to 55.1 from 55.4. Globally, Germany’s flash PMI improved to 52.4, the best result in 16 months, while its business climate index softened to 87.7. The U.K. PMI dipped to 51 amid higher labor and energy costs. In Asia, China held rates steady, Japan’s CPI was flat at 2.5% YoY, and Australia’s CPI rose to 3.0%,
leading to doubts that the country would see easing in the near term.


THE WEEK AHEAD

Markets enter October with the focus squarely on the labor market. JOLTS on Tuesday,
ADP on Wednesday, nonfarm payrolls, unemployment, and wage data on Friday will set
the tone for Fed policy expectations. Inflation remains a central theme. This week’s ISM
Manufacturing and Services PMIs will be closely watched for price pressures, while
global PMIs from Europe and China are expected to highlight diverging growth trends.
Consumer sentiment and wage data may offer clues to how much higher costs are
affecting demand. Commodity markets could see added volatility after Wednesday’s
OPEC meeting, where any signal on supply cuts would feed into inflation expectations.

Other factors to watch include U.S. Treasury auctions across the curve and the
upcoming Q3 earnings season, beginning with major banks. Fed commentary and
geopolitical developments remain potential swing factors. Together, these events may
drive sharp moves across equities, interest rates, and commodities as investors
reposition around data and policy risk.

(Schwab)

Annualized Return: The rate at which an investment grows each year over the period to arrive at the final valuation.

Bear Market: A decline of at least 20% from the market’s high point to its low.

Beta: A measure of how an individual asset moves when the overall stock market increases or decreases.

Correlation: A measure of the extent to which two variables are related.

Dividend Yield: The dividend yield or dividend-price ratio of a share is the dividend per share, divided by the price per share. It is also a company’s total annual dividend payments divided by its market capitalization, assuming the number of shares is constant.

Developed Markets: A country that is most developed in terms of its economy and capital markets. The country must be high income, but this also includes openness to foreign ownership, ease of capital movement, and efficiency of market institutions.

Emerging Markets: A country that has some characteristics of a developed market but does not fully meet its standards. This includes markets that may become developed markets in the future or were in the past.

Growth Factor Stocks: Growth stocks are companies expected to grow sales and earnings at a faster rate than the market average.

Large Cap Stocks: Shares of publicly traded corporations with a market capitalization of $10 billion or more.

LTM: An acronym for “Last Twelve Months” or the past one year.

NTM: An acronym for “Next Twelve Months” or the next one year.

Price Return: The rate of return on an investment portfolio, where the return measure takes into account only the capital appreciation of the portfolio, not including income generated in the form of interest or dividends.

Total Return: Return on a portfolio of investments including capital appreciation and income received on the portfolio.

Small Cap Stocks: Small-cap stocks are shares of companies with a market capitalization of less than $2 billion.

Standard Deviation: In statistics, the standard deviation is a measure of the amount of variation or dispersion of a set of values. A low standard deviation indicates the values tend to be close to the historical average of the data set, while a high standard deviation indicates the current value is outside of the historical average range.

Value Factor Stocks: Stocks that are inexpensive relative to the broad market based on measures of fundamental value (e.g., price to earnings or price to book).

Disclosures and legal notice

DISCLAIMER: Futures, stocks and options trading involves substantial risk of loss and is not suitable for every investor. The valuation of futures, stocks and options may fluctuate, and, as a result, clients may lose more than their original investment. The impact of seasonal and geopolitical events is already factored into market prices. The highly leveraged nature of futures trading means that small market movements will have a great impact on your trading account and this can work against you, leading to large losses or can work for you, leading to large gains.

  • If the market moves against you, you may sustain a total loss greater than the amount you deposited into your account. You are responsible for all the risks and financial resources you use and for the chosen trading system. You should not engage in trading unless you fully understand the nature of the transactions you are entering into and the extent of your exposure to loss. If you do not fully understand these risks you must seek independent advice from your financial advisor. All trading strategies are used at your own risk.
  • Any content on T2 Markets Research should not be relied upon as advice or construed as providing recommendations of any kind. It is your responsibility to confirm and decide which trades to make. Trade only with risk capital; that is, trade with money that, if lost, will not adversely impact your lifestyle and your ability to meet your financial obligations. Past results are no indication of future performance. In no event should the content of this correspondence be construed as an express or implied promise or guarantee.
  • T2 Markets Research is not responsible for any losses incurred as a result of using any of our trading strategies. Loss-limiting strategies such as stop loss orders may not be effective because market conditions or technological issues may make it impossible to execute such orders. Likewise, strategies using combinations of options and/or futures positions such as “spread” or “straddle” trades may be just as risky as simple long and short positions. Information provided in this correspondence is intended solely for informational purposes and is obtained from sources believed to be reliable. Information is in no way guaranteed. No guarantee of any kind is implied or possible where projections of future conditions are attempted.

Disclaimer: None of the content published on T2 Markets Research constitutes a recommendation that any particular security, portfolio of securities, transaction or investment strategy is suitable for any specific person. None of the information providers or their affiliates will advise you personally concerning the nature, potential, value or suitability of any particular security, portfolio of securities, transaction, investment strategy or other matter.

Free newsletter

Market Research & Analysis

Get our latest reports and commentary delivered to your inbox.

Keep reading

More from the research library

NVDA CEO out….or back in?

U.S equities staged a sharp rebound, recovering much of the prior week’s selloff despite continued weakness in one of the market’s largest components, Nvidia. The S&P 500 and Nasdaq advanced strongly as investors looked beyond the turmoil in the AI trade and responded to improving corporate earnings. The rebound was…
Read more →

Rebounding after a turbulent week

U.S. equities endured a turbulent week: after markets initially welcomed decisive victories that would leave no room for protracted court battles contesting the midterm results, investors on Thursday reassessed the implications for the massive AI infrastructure buildout in the wake of a number of states’ and municipalities’ anticipated opposition to data center construction.

Read more →

U.S. congressional elections to command attention this week

Technology and energy markets diverged sharply this week, while the Federal Reserve’s steady hand proved less decisive than initially suggested. Equities opened on a constructive note Monday following news of Anthropic’s S-1 filing, but sentiment reversed by midweek as hyperscaler earnings from Alphabet, Amazon, and Intel reignited concerns over the scale of AI-related capital expenditure.

Read more →

Free newsletter

Market Research & Analysis

Get our latest reports and commentary delivered to your inbox.

Inside a recent report

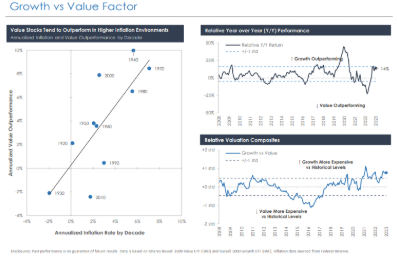
Growth vs Value Factor chart

Growth vs Value Factor — one of the charts from our research.