Lower rates, new equity highs

RECAPPING LAST WEEK

U.S. equity indices gained ground after the Federal Reserve restarted the interest rate easing cycle, lowering its benchmark rate by 25 basis points to a 4.00% to 4.25% range. The Russell 2000 index jumped more than 2%, reaching a new record high for the first time since last November. The Nasdaq Composite index also rose more than 2% while the S&P500 added just over 1%. Technology led mixed performance in S&P500 sectors, boosted by news of Nvidia’s massive investment in Intel. U.S. Treasury yields ended the week flat at the short end and higher at the long end despite the Fed signaling two additional rate cuts for this year.

While Fed Chair Powell said that the softening labor market was now top of mind for the committee, the central bank’s statement acknowledged that inflation hasn’t just remained elevated but has moved up. Powell characterized the rate decision as a “risk-management cut” in reaction to weakening jobs data, but stubborn inflation underscores the Fed’s challenges in carrying out its dual mandate. In its Summary of Economic Projections, the FOMC raised its GDP growth and inflation forecasts while lowering the projected unemployment rate, seemingly in conflict with easing monetary policy. The updated “dot plots” suggested only one more rate cut in 2026 to a range of 3.25% to 3.50%, which is higher than market expectations of a sub-3% fed funds rate.

Turning to economic data, U.S. retail sales rose 0.6% in August, rounding out a resilient summer of consumer spending. Jobless claims fell back to 231,000, likely confirming that the prior week’s large jump was an anomaly. Regional manufacturing surveys from the northeast revealed widely diverging sentiment. Activity in New York State declined more than expected on a large drop in new orders, while the Philly Fed survey spiked into positive territory as shipments surged. In housing news, new construction plunged last month while building permits fell to the lowest level in more than five years. Mortgage rates fell last week to 11-month lows, but persistent U.S. budgetary and inflation pressures still clouded the outlook for homebuyers seeking more affordable conditions.

Overseas, the Bank of England kept rates unchanged at 4% after last month’s CPI reading held steady at 3.8%–the highest among developed economies. UK labor market data has held up well enough to not raise recession concerns. The BOE also announced plans to slow the pace of reducing its stockpile of government bonds to minimize the impact on the volatile gilt markets. The Bank of Canada cut rates by 25 basis points to 2.5% but gave little indication of next steps even as economic data showed signs of increasing stress. Japan’s central bank revealed a more hawkish turn despite leaving rates unchanged at 0.5%. Two of the nine board members voted for a quarter-point hike while the Bank of Japan also decided to start selling its riskier ETF holdings sooner than expected. Core CPI readings have eased recently but Japan’s headline inflation has remained well above the 2% target for more than three years. Finally, China’s industrial production and retail sales figures for August came in lower than estimates, while unemployment inched up to a six-month high of 5.3%.


THE WEEK AHEAD

The U.S. dollar rallied late last week and volatility was mostly subdued, boosted by the Fed’s optimistic economic outlook and a muddled interest rate forecast beyond this year. Whether or not those trends continue could be influenced by several events on this week’s calendar. First, there are a plethora of appearances by FOMC members to be scrutinized.

Secondly, Friday’s PCE price index release is expected to show that inflation pressures are continuing to rise, albeit modestly. And third, flash PMI readings in the U.S. and elsewhere will provide a sense of how the manufacturing and services sectors are holding up as the end of the third quarter approaches. Other releases on the U.S. calendar include new and existing home sales, the final estimate of Q2 GDP, durable goods orders, and the goods trade balance for last month. Micron Technology reports earnings on Tuesday followed by Costco on Thursday.

On the international side, Japan’s inflation updates and minutes from last week’s BOJ meeting are the notable releases along with the previously mentioned flash PMI readings. Investors will continue to monitor U.S.-China trade negotiations and progress on the government funding bill that passed the U.S. House on Friday but faces an uphill battle in the Senate with the September 30 deadline looming.

(Schwab)

Annualized Return: The rate at which an investment grows each year over the period to arrive at the final valuation.

Bear Market: A decline of at least 20% from the market’s high point to its low.

Beta: A measure of how an individual asset moves when the overall stock market increases or decreases.

Correlation: A measure of the extent to which two variables are related.

Dividend Yield: The dividend yield or dividend-price ratio of a share is the dividend per share, divided by the price per share. It is also a company’s total annual dividend payments divided by its market capitalization, assuming the number of shares is constant.

Developed Markets: A country that is most developed in terms of its economy and capital markets. The country must be high income, but this also includes openness to foreign ownership, ease of capital movement, and efficiency of market institutions.

Emerging Markets: A country that has some characteristics of a developed market but does not fully meet its standards. This includes markets that may become developed markets in the future or were in the past.

Growth Factor Stocks: Growth stocks are companies expected to grow sales and earnings at a faster rate than the market average.

Large Cap Stocks: Shares of publicly traded corporations with a market capitalization of $10 billion or more.

LTM: An acronym for “Last Twelve Months” or the past one year.

NTM: An acronym for “Next Twelve Months” or the next one year.

Price Return: The rate of return on an investment portfolio, where the return measure takes into account only the capital appreciation of the portfolio, not including income generated in the form of interest or dividends.

Total Return: Return on a portfolio of investments including capital appreciation and income received on the portfolio.

Small Cap Stocks: Small-cap stocks are shares of companies with a market capitalization of less than $2 billion.

Standard Deviation: In statistics, the standard deviation is a measure of the amount of variation or dispersion of a set of values. A low standard deviation indicates the values tend to be close to the historical average of the data set, while a high standard deviation indicates the current value is outside of the historical average range.

Value Factor Stocks: Stocks that are inexpensive relative to the broad market based on measures of fundamental value (e.g., price to earnings or price to book).

Disclosures and legal notice

DISCLAIMER: Futures, stocks and options trading involves substantial risk of loss and is not suitable for every investor. The valuation of futures, stocks and options may fluctuate, and, as a result, clients may lose more than their original investment. The impact of seasonal and geopolitical events is already factored into market prices. The highly leveraged nature of futures trading means that small market movements will have a great impact on your trading account and this can work against you, leading to large losses or can work for you, leading to large gains.

  • If the market moves against you, you may sustain a total loss greater than the amount you deposited into your account. You are responsible for all the risks and financial resources you use and for the chosen trading system. You should not engage in trading unless you fully understand the nature of the transactions you are entering into and the extent of your exposure to loss. If you do not fully understand these risks you must seek independent advice from your financial advisor. All trading strategies are used at your own risk.
  • Any content on T2 Markets Research should not be relied upon as advice or construed as providing recommendations of any kind. It is your responsibility to confirm and decide which trades to make. Trade only with risk capital; that is, trade with money that, if lost, will not adversely impact your lifestyle and your ability to meet your financial obligations. Past results are no indication of future performance. In no event should the content of this correspondence be construed as an express or implied promise or guarantee.
  • T2 Markets Research is not responsible for any losses incurred as a result of using any of our trading strategies. Loss-limiting strategies such as stop loss orders may not be effective because market conditions or technological issues may make it impossible to execute such orders. Likewise, strategies using combinations of options and/or futures positions such as “spread” or “straddle” trades may be just as risky as simple long and short positions. Information provided in this correspondence is intended solely for informational purposes and is obtained from sources believed to be reliable. Information is in no way guaranteed. No guarantee of any kind is implied or possible where projections of future conditions are attempted.

Disclaimer: None of the content published on T2 Markets Research constitutes a recommendation that any particular security, portfolio of securities, transaction or investment strategy is suitable for any specific person. None of the information providers or their affiliates will advise you personally concerning the nature, potential, value or suitability of any particular security, portfolio of securities, transaction, investment strategy or other matter.

Free newsletter

Market Research & Analysis

Get our latest reports and commentary delivered to your inbox.

Keep reading

More from the research library

NVDA CEO out….or back in?

U.S equities staged a sharp rebound, recovering much of the prior week’s selloff despite continued weakness in one of the market’s largest components, Nvidia. The S&P 500 and Nasdaq advanced strongly as investors looked beyond the turmoil in the AI trade and responded to improving corporate earnings. The rebound was…
Read more →

Rebounding after a turbulent week

U.S. equities endured a turbulent week: after markets initially welcomed decisive victories that would leave no room for protracted court battles contesting the midterm results, investors on Thursday reassessed the implications for the massive AI infrastructure buildout in the wake of a number of states’ and municipalities’ anticipated opposition to data center construction.

Read more →

U.S. congressional elections to command attention this week

Technology and energy markets diverged sharply this week, while the Federal Reserve’s steady hand proved less decisive than initially suggested. Equities opened on a constructive note Monday following news of Anthropic’s S-1 filing, but sentiment reversed by midweek as hyperscaler earnings from Alphabet, Amazon, and Intel reignited concerns over the scale of AI-related capital expenditure.

Read more →

Free newsletter

Market Research & Analysis

Get our latest reports and commentary delivered to your inbox.

Inside a recent report

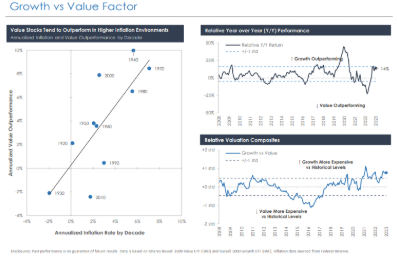
Growth vs Value Factor chart

Growth vs Value Factor — one of the charts from our research.