Mag 7 and FOMC showdown

RECAPPING LAST WEEK

With the exception of the Nasdaq–100’s 2% pop. U.S equity markets were mostly flat, with no
other index moving even 1%. We would expect to see some consolidation after the multi–week
April rally, with the S&P500 up nearly 12% from its March 30 low. While Nasdaq stars the
Magnificent 7, and shared in the sector’s gains, they were not driving outperformance. Instead,
semiconductor strength carried the tape, helped by Intel’s strong revenue outlook and a broader
chip rally. Oil remained central to the macro narrative, with WTI crude rallying 12%. While oil
eased Friday on hopes for renewed U.S.–Iran diplomacy, Middle East supply concerns related to
the Strait of Hormuz chokepoint have kept prices elevated. Interest rate yields drifted higher and
expectations for Fed rate cuts continued to fade as observers recognize that the Fed faces a
complicated path navigating higher oil prices and geopolitical risk. March retail sales surged
1.7%, their best monthly change in more than a year, signaling that higher gas prices have not yet
led the American consumer to cut their discretionary spending. Housing demand aligned with
retail spend, with pending home sales 1.5% higher despite rising mortgage rates. Manufacturing
and services PMI registered expansion above 50, pushing the S&P Global Composite PMI to 52.
Jobless claims ticked up to 214K—not high enough to stoke additional labor market concerns.
Consumer sentiment fell near the bear–market lows of 2022, even as equities today are registering
new record highs. The preceding numbers still reflect a great deal of uncertainty, both from the
ongoing war in Iran and from the incoming Fed Chair Kevin Warsh. His “regime change” testimony
in front of the senate last week has caused concern about future policy direction. As has been the
case since the start of the war, global markets looked fragile compared to the U.S. The German
flash composite PMI fell to 48.3 and the sinking IFO Business Climate Index indicated the
direction of corporate sentiment. Consumer sentiment in the eurozone dropped to a 3–year low.
In the U.K., unemployment rose to 5.2% as CPI rose to 3.3%, reminding investors that inflation is
omnipresent. Japan’s core inflation accelerated to 1.8%, as businesses reported the fastest–ever
recorded increase in selling prices, and manufacturing activity started to slow. Australian PMIs
crossed back into expansion, but here too, inflation surged to a 4–year high.

THE WEEK AHEAD

The chief macro event risk at the moment relates to the Fed—the impact of this week’s meeting
will likely come more from the statement and press conference than the rate decision itself. Will
policymakers emphasize sticky inflation, oil–driven price risk, still–resilient growth, or any opening
for future rate cuts? Despite rising yields, firmer energy prices, and a steady drumbeat of
headline risk, equity indices managed to keep rolling higher last week. Still, their Sisyphean climb
is slowing as each policy post and diplomatic flare–up adds a few pebbles’ weight to the boulder.
On the domestic front, labor market data and forward–looking metrics from retail sales and PMIs
will help assess whether growth remains resilient or if any knock–on effects from spiking energy
costs are filtering through. Thursday features the Fed’s preferred metric for inflation, core PCE.
Advance GDP q/q, and weekly unemployment claims arrive as well. On the earnings front, mega–
cap technology earnings will be the equity–market stress test: Microsoft, Alphabet, Amazon, Meta,
and Apple are expected to report, providing investors with a direct referendum on AI capex, cloud
demand, margins, and whether these stocks’ index leadership can continue. Internationally, global
central banks meet this week with Japan, Canada, and the U.K. all making rate statements and
Wednesday morning a release of EUR M3 money supply. Keep an eye on European data to see if
their sluggish activity continues, and more importantly how the ECB reacts to it. It will all be
greatly impacted by what happens in Iran, the Strait of Hormuz, and energy prices.

(Schwab)

Annualized Return: The rate at which an investment grows each year over the period to arrive at the final valuation.

Bear Market: A decline of at least 20% from the market’s high point to its low.

Beta: A measure of how an individual asset moves when the overall stock market increases or decreases.

Correlation: A measure of the extent to which two variables are related.

Dividend Yield: The dividend yield or dividend-price ratio of a share is the dividend per share, divided by the price per share. It is also a company’s total annual dividend payments divided by its market capitalization, assuming the number of shares is constant.

Developed Markets: A country that is most developed in terms of its economy and capital markets. The country must be high income, but this also includes openness to foreign ownership, ease of capital movement, and efficiency of market institutions.

Emerging Markets: A country that has some characteristics of a developed market but does not fully meet its standards. This includes markets that may become developed markets in the future or were in the past.

Growth Factor Stocks: Growth stocks are companies expected to grow sales and earnings at a faster rate than the market average.

Large Cap Stocks: Shares of publicly traded corporations with a market capitalization of $10 billion or more.

LTM: An acronym for “Last Twelve Months” or the past one year.

NTM: An acronym for “Next Twelve Months” or the next one year.

Price Return: The rate of return on an investment portfolio, where the return measure takes into account only the capital appreciation of the portfolio, not including income generated in the form of interest or dividends.

Total Return: Return on a portfolio of investments including capital appreciation and income received on the portfolio.

Small Cap Stocks: Small-cap stocks are shares of companies with a market capitalization of less than $2 billion.

Standard Deviation: In statistics, the standard deviation is a measure of the amount of variation or dispersion of a set of values. A low standard deviation indicates the values tend to be close to the historical average of the data set, while a high standard deviation indicates the current value is outside of the historical average range.

Value Factor Stocks: Stocks that are inexpensive relative to the broad market based on measures of fundamental value (e.g., price to earnings or price to book).

Disclosures and legal notice

DISCLAIMER: Futures, stocks and options trading involves substantial risk of loss and is not suitable for every investor. The valuation of futures, stocks and options may fluctuate, and, as a result, clients may lose more than their original investment. The impact of seasonal and geopolitical events is already factored into market prices. The highly leveraged nature of futures trading means that small market movements will have a great impact on your trading account and this can work against you, leading to large losses or can work for you, leading to large gains.

  • If the market moves against you, you may sustain a total loss greater than the amount you deposited into your account. You are responsible for all the risks and financial resources you use and for the chosen trading system. You should not engage in trading unless you fully understand the nature of the transactions you are entering into and the extent of your exposure to loss. If you do not fully understand these risks you must seek independent advice from your financial advisor. All trading strategies are used at your own risk.
  • Any content on T2 Markets Research should not be relied upon as advice or construed as providing recommendations of any kind. It is your responsibility to confirm and decide which trades to make. Trade only with risk capital; that is, trade with money that, if lost, will not adversely impact your lifestyle and your ability to meet your financial obligations. Past results are no indication of future performance. In no event should the content of this correspondence be construed as an express or implied promise or guarantee.
  • T2 Markets Research is not responsible for any losses incurred as a result of using any of our trading strategies. Loss-limiting strategies such as stop loss orders may not be effective because market conditions or technological issues may make it impossible to execute such orders. Likewise, strategies using combinations of options and/or futures positions such as “spread” or “straddle” trades may be just as risky as simple long and short positions. Information provided in this correspondence is intended solely for informational purposes and is obtained from sources believed to be reliable. Information is in no way guaranteed. No guarantee of any kind is implied or possible where projections of future conditions are attempted.

Disclaimer: None of the content published on T2 Markets Research constitutes a recommendation that any particular security, portfolio of securities, transaction or investment strategy is suitable for any specific person. None of the information providers or their affiliates will advise you personally concerning the nature, potential, value or suitability of any particular security, portfolio of securities, transaction, investment strategy or other matter.

Free newsletter

Market Research & Analysis

Get our latest reports and commentary delivered to your inbox.

Keep reading

More from the research library

Short-term yields rising

Global equity markets remained remarkably resilient last week despite another sharp rise in interest rates, elevated energy prices, and the first rate hike from the Federal Reserve in more than three years. U.S. equities initially came under pressure following Wednesdays widely anticipated 25 basis point increase in the Fed Funds target rate to 3.75%-4%, but the selloff was relatively short-lived, with most major indices recovering from their knee-jerk response to the rate announcement.

Read more →

Investors focused on the FOMC’s 2-day meeting

Global equity markets were under pressure last week with rising energy prices, escalating U.S.-Iran hostilities, and another leg higher in Treasury yields. U.S. equities gave back much of the gains from the prior week, with the S&P 500, Nasdaq 100, and Russell 2000 all slipping a little Tuesday through Thursday before regaining some ground on Friday. The selloff was relatively orderly, with the market continuing to focus on whether the increase in energy prices represents a temporary
geopolitical shock or the beginning of a more persistent inflation problem.

Read more →

Final look at inflation data

Global equity markets were quietly choppy this week as investors grappled with a rise in global bond yields, a renewed escalation in U.S.-Iranian hostilities and a shifting outlook for Fed policy.U.S. equities came under pressure early in the week as the global bond selloff and higher energy prices challenged elevated valuations, although stocks recovered as the week progressed, with theS&P 500, Nasdaq 100, and Russell 2000 posting modest gains of under a half a percent.

Read more →

Free newsletter

Market Research & Analysis

Get our latest reports and commentary delivered to your inbox.

Inside a recent report

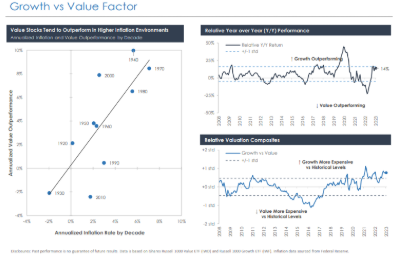
Growth vs Value Factor chart

Growth vs Value Factor — one of the charts from our research.