Short-term yields rising

RECAPPING LAST WEEK


Global equity markets remained remarkably resilient last week despite another sharp rise in
interest rates, elevated energy prices, and the first rate hike from the Federal Reserve in more
than three years. U.S. equities initially came under pressure following Wednesdays widely
anticipated 25 basis point increase in the Fed Funds target rate to 3.75%-4%, but the selloff was
relatively short-lived, with most major indices recovering from their knee-jerk response to the rate
announcement. The S&P 500 and Nasdaq remained close to their recent highs while the Dow and
Russell underperformed. The biggest focus remained on the Fed meeting and the implications of
the first rate hike since 2023. While the increase itself was widely expected (Fed Funds futures
were priced at a 93% probability), the Fed’s indication that another hike could come before year-
end pushed shorter-term Treasury yields higher, while longer-term yields were comparatively
stable. The resulting flattening of the yield curve reflected the market’s view that monetary policy
will remain restrictive even as longer-term inflation expectations appear more contained. Crude oil
prices finally showed some signs of easing, with Brent and WTI both pulling back as Saudi Arabia
indicated that additional production could return to the market. The decline in crude, however, has
not translated into lower prices for refined products, with U.S. diesel prices reaching another all-
time high well above $6 per gallon. The inelastic demand from the global trucking and shipping
industry, the additional seasonal demand from farmers during the fall harvest and the onset of the
heating season, combined with supply disruptions primarily related to the Russian Ukrainian war
have all created the perfect storm for this lifeblood of the global economy. The U.S. Dollar also
responded favorably to the Fed rate hike, including adding an additional leg up against the Yen
after the Bank of Japan matched the Fed’s rate hike with its own widely anticipated 25 basis point
hike on Friday. Crypto markets were also notably resilient despite the Senate’s failure to advance
the CLARITY Act. The legislation sought to establish a comprehensive regulatory framework for
digital assets by defining and delineating responsibilities between the SEC and CFTC. Shortly after
the bill failed in the Senate, the SEC issued an “Innovation Exemption” for the next five years
around Tokenized Securities Venues, which provided further support for the sector. In S&P
Sectors, Healthcare was the best performer while the rate-sensitive Utilities and Financial sectors
were the worst. Overall, the week continued to highlight the resilience of risk assets in the face of a
more challenging macro environment driven by higher rates and energy costs.


THE WEEK AHEAD


Investors will have a relatively light economic calendar to digest next week, leaving markets
focused on the signals that could influence expectations for another Fed Funds hike in October.
Futures markets are currently pricing in a 57% probability of a 25-basis point increase. The
Treasury market will provide an important real-time signal, particularly if short-term yields
continue to rise relative to longer maturities. A further flattening of the yield curve would indicate
that markets are increasing the probability of additional near-term tightening and growing
increasingly optimistic that the Fed will be able to slay the inflation dragon. The two-year is already
trading 88 basis points above the overnight effective Fed Funds rate, contrasted against the 2s-10s
spread which has flattened to 27 basis points. Of course, oil prices, largely driven by the
uncertainty surrounding the U.S.-Iranian conflict, remain problematic in dampening those inflation
expectations. As outlined above, the tightness in the diesel market has the potential to be truly
disruptive in the coming weeks. European politicians have jumped into the fray, threatening a
“windfall profits” tax on refiners, but that rhetoric will do nothing to solve for the upcoming
seasonal increase in demand combined with the reduction in refining capacity. Through it all,
equities have continued to hold their own in these upwind conditions, seemingly awaiting the day
that the macro environment provides a tailwind for the next leg of their journey.

(Schwab)

Annualized Return: The rate at which an investment grows each year over the period to arrive at the final valuation.

Bear Market: A decline of at least 20% from the market’s high point to its low.

Beta: A measure of how an individual asset moves when the overall stock market increases or decreases.

Correlation: A measure of the extent to which two variables are related.

Dividend Yield: The dividend yield or dividend-price ratio of a share is the dividend per share, divided by the price per share. It is also a company’s total annual dividend payments divided by its market capitalization, assuming the number of shares is constant.

Developed Markets: A country that is most developed in terms of its economy and capital markets. The country must be high income, but this also includes openness to foreign ownership, ease of capital movement, and efficiency of market institutions.

Emerging Markets: A country that has some characteristics of a developed market but does not fully meet its standards. This includes markets that may become developed markets in the future or were in the past.

Growth Factor Stocks: Growth stocks are companies expected to grow sales and earnings at a faster rate than the market average.

Large Cap Stocks: Shares of publicly traded corporations with a market capitalization of $10 billion or more.

LTM: An acronym for “Last Twelve Months” or the past one year.

NTM: An acronym for “Next Twelve Months” or the next one year.

Price Return: The rate of return on an investment portfolio, where the return measure takes into account only the capital appreciation of the portfolio, not including income generated in the form of interest or dividends.

Total Return: Return on a portfolio of investments including capital appreciation and income received on the portfolio.

Small Cap Stocks: Small-cap stocks are shares of companies with a market capitalization of less than $2 billion.

Standard Deviation: In statistics, the standard deviation is a measure of the amount of variation or dispersion of a set of values. A low standard deviation indicates the values tend to be close to the historical average of the data set, while a high standard deviation indicates the current value is outside of the historical average range.

Value Factor Stocks: Stocks that are inexpensive relative to the broad market based on measures of fundamental value (e.g., price to earnings or price to book).

Disclosures and legal notice

DISCLAIMER: Futures, stocks and options trading involves substantial risk of loss and is not suitable for every investor. The valuation of futures, stocks and options may fluctuate, and, as a result, clients may lose more than their original investment. The impact of seasonal and geopolitical events is already factored into market prices. The highly leveraged nature of futures trading means that small market movements will have a great impact on your trading account and this can work against you, leading to large losses or can work for you, leading to large gains.

  • If the market moves against you, you may sustain a total loss greater than the amount you deposited into your account. You are responsible for all the risks and financial resources you use and for the chosen trading system. You should not engage in trading unless you fully understand the nature of the transactions you are entering into and the extent of your exposure to loss. If you do not fully understand these risks you must seek independent advice from your financial advisor. All trading strategies are used at your own risk.
  • Any content on T2 Markets Research should not be relied upon as advice or construed as providing recommendations of any kind. It is your responsibility to confirm and decide which trades to make. Trade only with risk capital; that is, trade with money that, if lost, will not adversely impact your lifestyle and your ability to meet your financial obligations. Past results are no indication of future performance. In no event should the content of this correspondence be construed as an express or implied promise or guarantee.
  • T2 Markets Research is not responsible for any losses incurred as a result of using any of our trading strategies. Loss-limiting strategies such as stop loss orders may not be effective because market conditions or technological issues may make it impossible to execute such orders. Likewise, strategies using combinations of options and/or futures positions such as “spread” or “straddle” trades may be just as risky as simple long and short positions. Information provided in this correspondence is intended solely for informational purposes and is obtained from sources believed to be reliable. Information is in no way guaranteed. No guarantee of any kind is implied or possible where projections of future conditions are attempted.

Disclaimer: None of the content published on T2 Markets Research constitutes a recommendation that any particular security, portfolio of securities, transaction or investment strategy is suitable for any specific person. None of the information providers or their affiliates will advise you personally concerning the nature, potential, value or suitability of any particular security, portfolio of securities, transaction, investment strategy or other matter.

Free newsletter

Market Research & Analysis

Get our latest reports and commentary delivered to your inbox.

Keep reading

More from the research library

Investors focused on the FOMC’s 2-day meeting

Global equity markets were under pressure last week with rising energy prices, escalating U.S.-Iran hostilities, and another leg higher in Treasury yields. U.S. equities gave back much of the gains from the prior week, with the S&P 500, Nasdaq 100, and Russell 2000 all slipping a little Tuesday through Thursday before regaining some ground on Friday. The selloff was relatively orderly, with the market continuing to focus on whether the increase in energy prices represents a temporary
geopolitical shock or the beginning of a more persistent inflation problem.

Read more →

Final look at inflation data

Global equity markets were quietly choppy this week as investors grappled with a rise in global bond yields, a renewed escalation in U.S.-Iranian hostilities and a shifting outlook for Fed policy.U.S. equities came under pressure early in the week as the global bond selloff and higher energy prices challenged elevated valuations, although stocks recovered as the week progressed, with theS&P 500, Nasdaq 100, and Russell 2000 posting modest gains of under a half a percent.

Read more →

Payrolls are expected to recover

Global markets were relatively quiet this past week with most major macro asset classes modestly reversing some of the prior week’s sharper moves in a quiet consolidation. The S&P 500 and Nasdaq 100 each rose about a half of a percent, while the small-cap Russell 2000 fell 1.5%.

Read more →

Free newsletter

Market Research & Analysis

Get our latest reports and commentary delivered to your inbox.

Inside a recent report

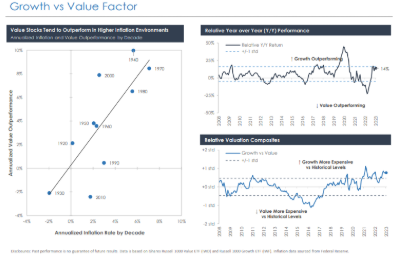
Growth vs Value Factor chart

Growth vs Value Factor — one of the charts from our research.