Equity Volatility Rising

July 23rd, 2024

LAST WEEK’S RECAP

Equity volatility rose to the highest levels since April as the seismic rotation out of U.S. mega-cap stocks continued for a second straight week. Additionally, geopolitical risk in the semiconductor sector contributed to the divided results for U.S. equity indices. The Nasdaq Composite index sank 3.7%, while the S&P500 slid 2%. The Russell 2000 finally pulled back late last week but still added 1.7% to its recent run. S&P500 sector performance was spilt, but technology was notably weaker after the Biden administration told allies it is considering tougher restrictions on companies that continue to make advanced semiconductors available to China.

The PHLX Semiconductor index plunged nearly 9% for the week. Crude oil prices were lifted mid-week by a drawdown in U.S. inventories but ended lower by 4%. China’s leadership party plenum failed to convince traders that any major stimulus measures were forthcoming that might support oil demand. Gold futures eased after reaching a new all-time high on Tuesday. U.S. Treasury yields finished modestly higher on stronger economic data. Retail sales rose in June by the most in three months, while industrial production advanced 0.6% MoM. U.S. housing starts rebounded last month, although single-family home construction declined to an eight-month low as high mortgage rates continued to hamper affordability. Weekly jobless claims jumped to 243k, suggesting more difficulty for Americans seeking new employment.

Elsewhere, the European Central Bank made no change in monetary policy after cutting rates last month. Its statement was in line with expectations, and market pricing suggested two additional quarter-point cuts this year. In the UK, CPI held at 2% YoY in June, with services inflation proving to be sticky. Despite slowing wage growth, a cooling labor market, and declining retail sales, British investors pared down odds of a rate cut at the August 1 central bank meeting. Canada’s inflation rate dropped to 2.7% YoY in June, giving the Bank of Canada plenty of runway to lower interest rates at the July 24 meeting. Finally, China’s economic data missed the mark, with GDP and retail sales growth both coming in below forecasts. The central committee’s communication following the Third Plenum was described as lacking specific measures to address the country’s economic struggles.

THE WEEK AHEAD

This is a pivotal week for U.S. investors, as the economic calendar features the first estimate of second-quarter GDP, June’s core PCE price index, and plenty of corporate earnings announcements.

Forecasts are calling for 1.9% GDP growth and a slight uptick in the core PCE reading. Prior to both releases, Wednesday’s global flash PMI figures may provide a more up-to-date look at economic performance in the first part of July, along with a look at how prices for goods and services are fluctuating.

This week’s earnings releases include Alphabet, Tesla, IBM, United Parcel Service, American Airlines Group, 3M Co., and many more. The rest of the U.S. economic agenda consists of new and existing home sales, durable goods orders, and revised consumer sentiment figures. Investors will also be watching how markets react to the rapidly changing U.S. political landscape after President Biden announced over the weekend that he would not seek re-election.

On the international side, the Bank of Canada is expected to cut interest rates by 25bps for the second straight meeting on Wednesday, but traders are split on how strongly the bank will signal its intentions for the rest of the year. Last of all, Japan’s Tokyo CPI data on Thursday evening could provide more clarity on rate hike probabilities when the Bank of Japan meets later this month.

(source: Charles Schwab)

Annualized Return: The rate at which an investment grows each year over the period to arrive at the final valuation.

Bear Market: A decline of at least 20% from the market’s high point to its low.

Beta: A measure of how an individual asset moves when the overall stock market increases or decreases.

Correlation: A measure of the extent to which two variables are related.

Dividend Yield: The dividend yield or dividend-price ratio of a share is the dividend per share, divided by the price per share. It is also a company’s total annual dividend payments divided by its market capitalization, assuming the number of shares is constant.

Developed Markets: A country that is most developed in terms of its economy and capital markets. The country must be high income, but this also includes openness to foreign ownership, ease of capital movement, and efficiency of market institutions.

Emerging Markets: A country that has some characteristics of a developed market but does not fully meet its standards. This includes markets that may become developed markets in the future or were in the past.

Growth Factor Stocks: Growth stocks are companies expected to grow sales and earnings at a faster rate than the market average.

Large Cap Stocks: Shares of publicly traded corporations with a market capitalization of $10 billion or more.

LTM: An acronym for “Last Twelve Months” or the past one year.

NTM: An acronym for “Next Twelve Months” or the next one year.

Price Return: The rate of return on an investment portfolio, where the return measure takes into account only the capital appreciation of the portfolio, not including income generated in the form of interest or dividends.

Total Return: Return on a portfolio of investments including capital appreciation and income received on the portfolio.

Small Cap Stocks: Small-cap stocks are shares of companies with a market capitalization of less than $2 billion.

Standard Deviation: In statistics, the standard deviation is a measure of the amount of variation or dispersion of a set of values. A low standard deviation indicates the values tend to be close to the historical average of the data set, while a high standard deviation indicates the current value is outside of the historical average range.

Value Factor Stocks: Stocks that are inexpensive relative to the broad market based on measures of fundamental value (e.g., price to earnings or price to book).

Disclosures and legal notice

DISCLAIMER: Futures, stocks and options trading involves substantial risk of loss and is not suitable for every investor. The valuation of futures, stocks and options may fluctuate, and, as a result, clients may lose more than their original investment. The impact of seasonal and geopolitical events is already factored into market prices. The highly leveraged nature of futures trading means that small market movements will have a great impact on your trading account and this can work against you, leading to large losses or can work for you, leading to large gains.

  • If the market moves against you, you may sustain a total loss greater than the amount you deposited into your account. You are responsible for all the risks and financial resources you use and for the chosen trading system. You should not engage in trading unless you fully understand the nature of the transactions you are entering into and the extent of your exposure to loss. If you do not fully understand these risks you must seek independent advice from your financial advisor. All trading strategies are used at your own risk.
  • Any content on T2 Markets Research should not be relied upon as advice or construed as providing recommendations of any kind. It is your responsibility to confirm and decide which trades to make. Trade only with risk capital; that is, trade with money that, if lost, will not adversely impact your lifestyle and your ability to meet your financial obligations. Past results are no indication of future performance. In no event should the content of this correspondence be construed as an express or implied promise or guarantee.
  • T2 Markets Research is not responsible for any losses incurred as a result of using any of our trading strategies. Loss-limiting strategies such as stop loss orders may not be effective because market conditions or technological issues may make it impossible to execute such orders. Likewise, strategies using combinations of options and/or futures positions such as “spread” or “straddle” trades may be just as risky as simple long and short positions. Information provided in this correspondence is intended solely for informational purposes and is obtained from sources believed to be reliable. Information is in no way guaranteed. No guarantee of any kind is implied or possible where projections of future conditions are attempted.

Disclaimer: None of the content published on T2 Markets Research constitutes a recommendation that any particular security, portfolio of securities, transaction or investment strategy is suitable for any specific person. None of the information providers or their affiliates will advise you personally concerning the nature, potential, value or suitability of any particular security, portfolio of securities, transaction, investment strategy or other matter.

Free newsletter

Market Research & Analysis

Get our latest reports and commentary delivered to your inbox.

Keep reading

More from the research library

Packed economic and earnings calendar

U.S. equities delivered a mixed performance this week as investors navigated a sharp decline in Treasury yields, escalating geopolitical risk, and growing concerns about the sustainability of the
AI investment boom. Beneath the headline indices, the divergence between technology stocks and the broader market became increasingly pronounced as investors reassessed the valuations of companies at the center of the AI trade.

Read more →

Hotter-than-expected inflation data pressures markets

U.S. equities came under renewed pressure this week as hotter-than-expected inflation data forced investors to reassess both the interest rate outlook and the sustainability of the AI investment boom. The September CPI report showed headline inflation rising 0.6% for the month and 3.7% year-over-year, while core CPI increased 0.3% for the month and 2.6% for the year—this reading comes in above both the Fed’s stated 2.0% target and the high end of economist expectations.

Read more →

Credit-market stability and earnings quality

U.S. equity markets overall continued to rise, with both the S&P 500 and Nasdaq notching fresh all-time highs. The beleaguered Russell small cap index, however, continued to underperform. European markets were down modestly while Asian markets advanced. Treasury yields surged to fresh highs on Wednesday before cooling by the week’s end as rates and borrowing costs remained a major focus.

Read more →

Free newsletter

Market Research & Analysis

Get our latest reports and commentary delivered to your inbox.

Inside a recent report

Growth vs Value Factor chart

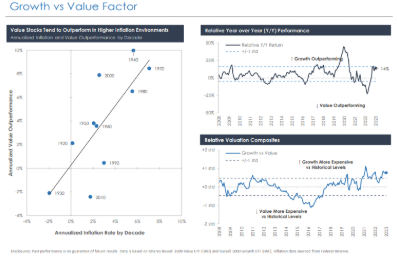
Growth vs Value Factor — one of the charts from our research.